Real-Time Options GEX Dashboard
A live-streaming gamma/vanna/charm exposure dashboard with full historical replay, built to replace paid delayed-snapshot options tools.
The Problem
Retail options-flow analysis mostly happens through paid third-party dashboards that show gamma exposure (GEX) as a static, delayed snapshot, with no way to see how dealer positioning is actually shifting through market hours. I wanted a live, streaming view of gamma, vanna, and charm exposure and key dealer hedging levels for a personal watchlist of tickers, plus the ability to replay historical sessions at full fidelity to study how GEX regimes evolved around specific market events — something no off-the-shelf tool offered without an expensive subscription, and none offered with replay at all.
The Solution
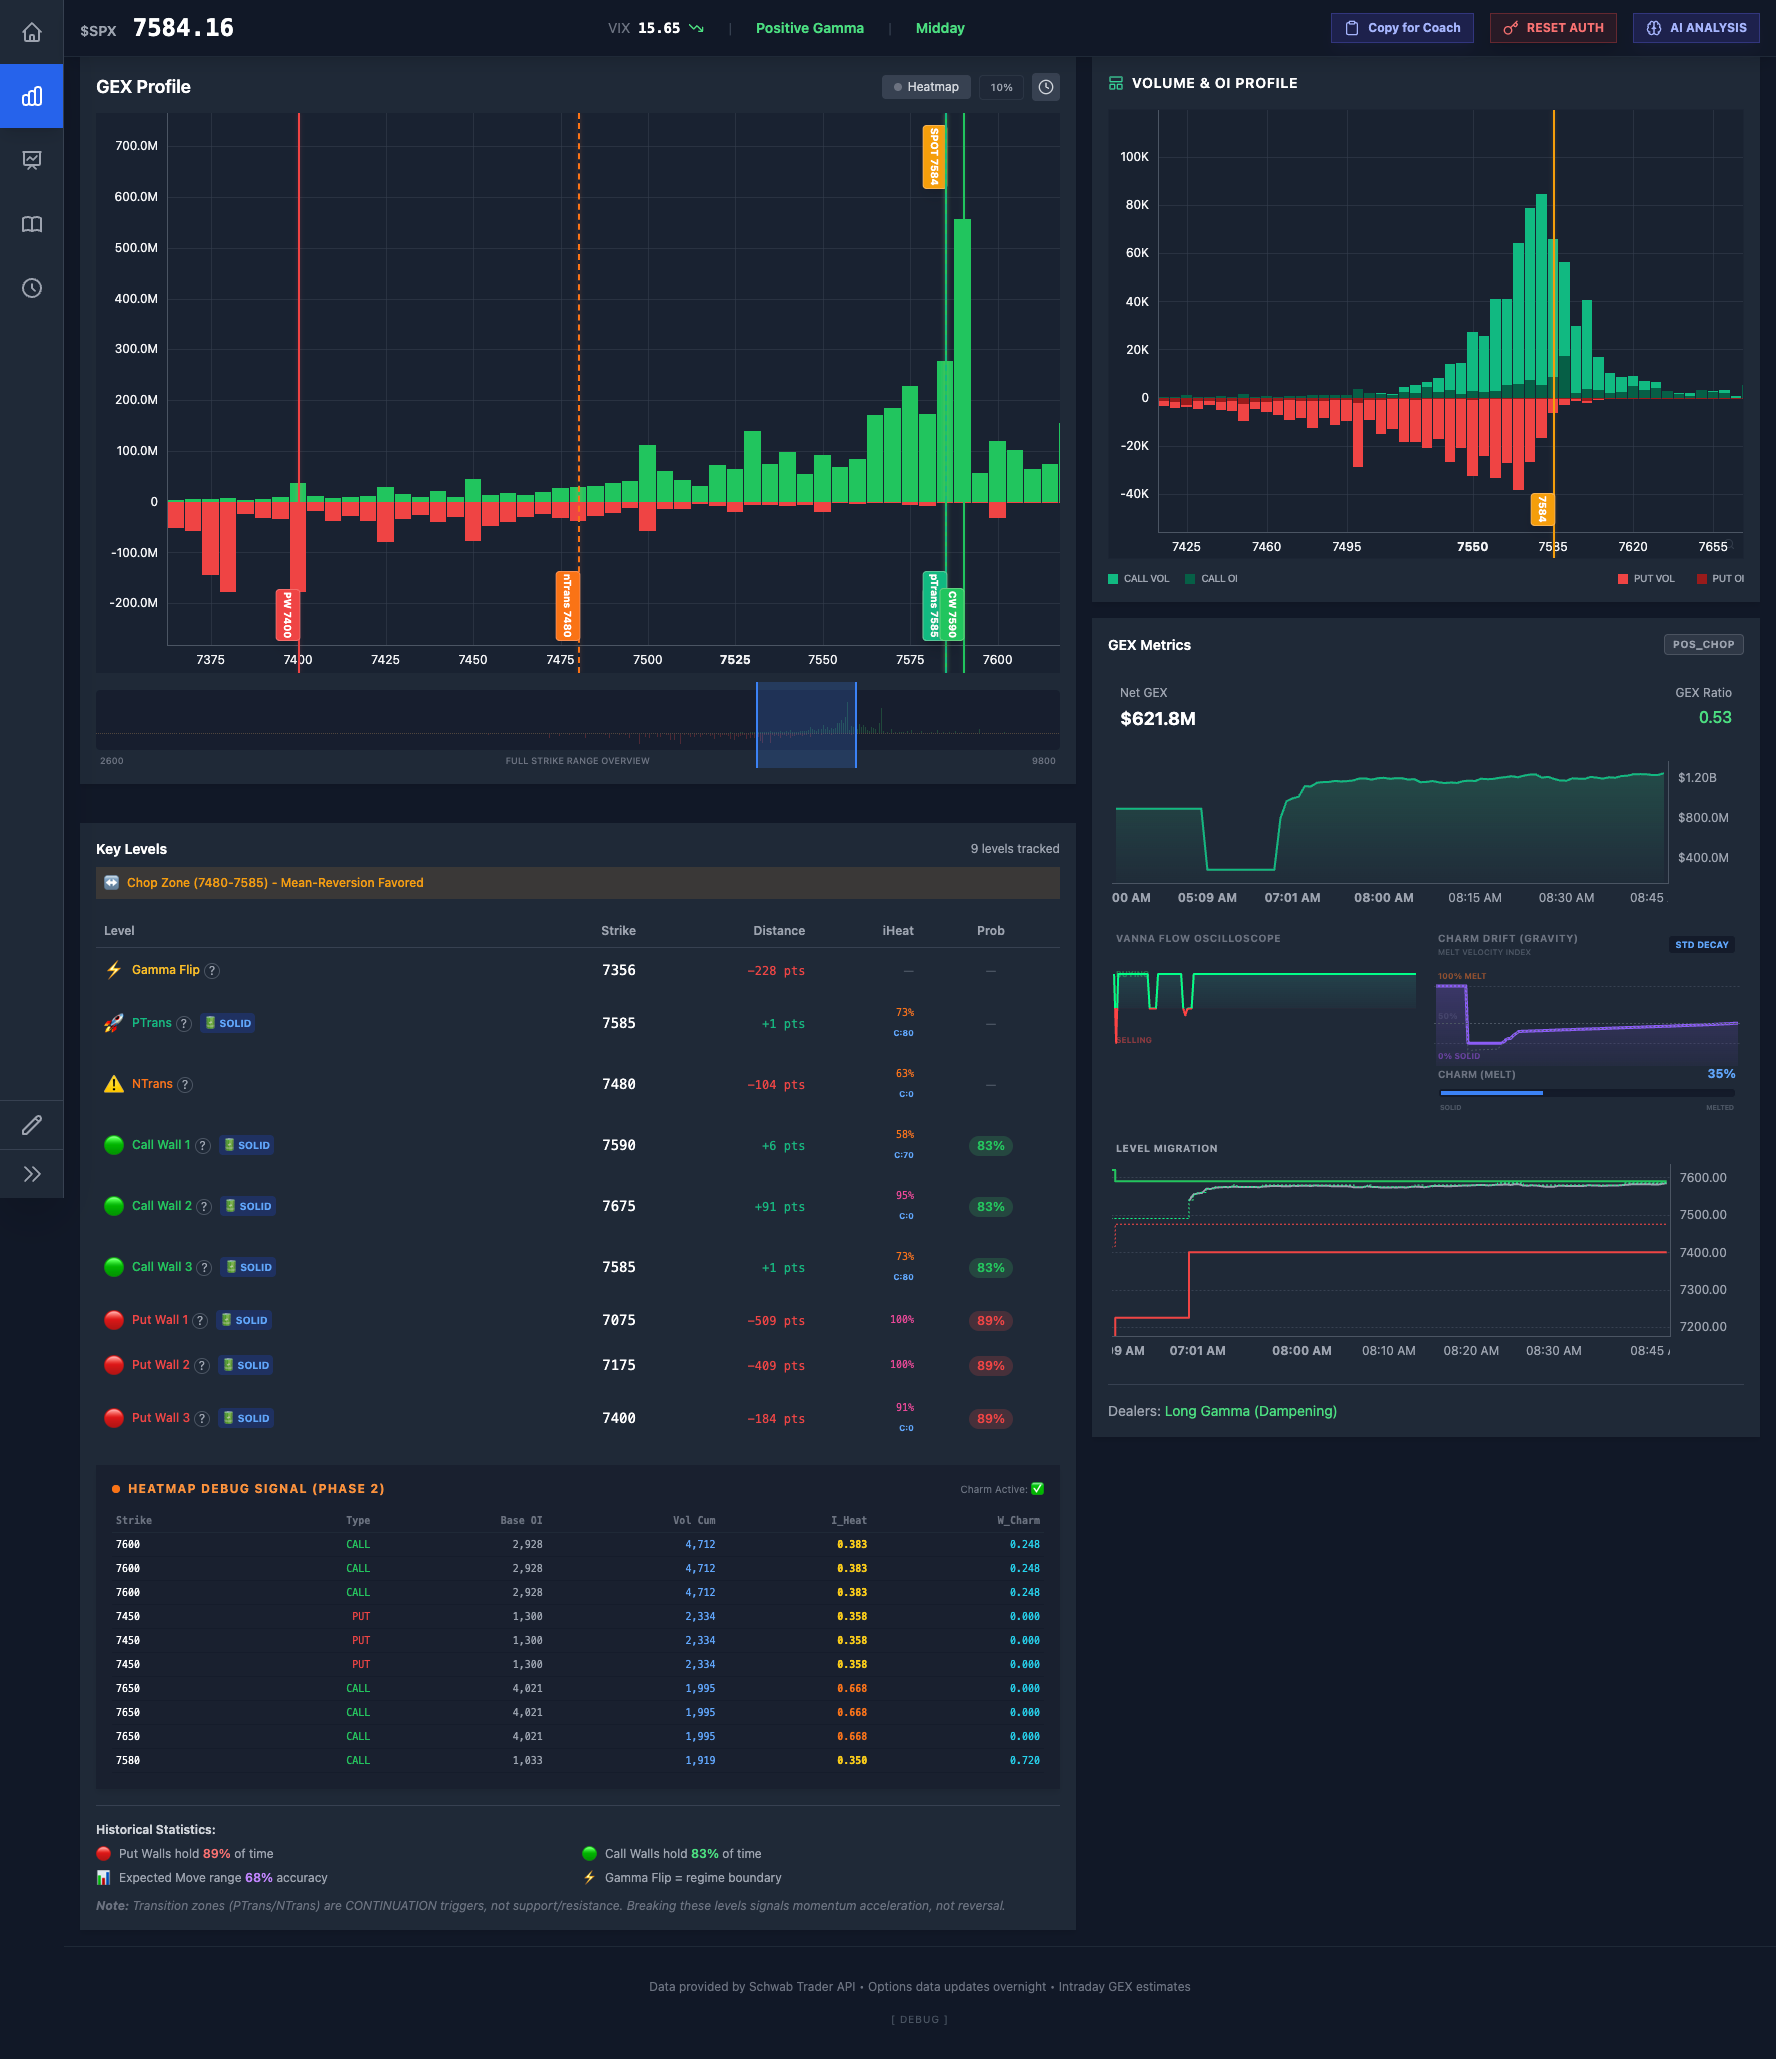
A real-time gamma exposure dashboard that streams live options-derived metrics — net GEX, vanna, charm, and implied-volatility surface signals — for a watchlist of tickers, renders key dealer hedging levels and regime signals on interactive price charts, and layers an AI-generated narrative brief on top so a ticker’s positioning can be scanned in seconds instead of reading a raw options chain. It also has a full historical replay mode that reconstructs GEX from stored tick data, so I can step through past sessions exactly as they streamed live.
Outcome & Impact
This is the piece of my personal market-analysis toolkit I check most often — my primary options-positioning reference, and by a wide margin the most heavily developed area of the project, with well over 250 commits touching GEX-specific code against roughly 540 total across the toolkit. It replaced a workflow that previously meant manually pulling options chains and eyeballing open interest with a live streaming view, around 35 dedicated backend services, and roughly 38 frontend components covering both live and full historical replay.
| Metric | Detail |
|---|---|
| Usage | Checked regularly during market hours; primary reference for options positioning |
| Development volume | 250+ commits on GEX-specific code, out of ~540 total across the toolkit |
| Footprint | ~38 frontend components, ~33 dedicated backend services |
| Data modes | Live streaming (brokerage OAuth) and full historical replay |
My Role & Contributions
| Aspect | Detail |
|---|---|
| Role | Sole architect and engineer, solo personal project (the most heavily developed piece of a larger self-built market-analysis toolkit) |
| Team size | 1 |
| Timeline | Actively developed and used over roughly a year and a half, still in daily use |
| Scope | Live options-chain ingestion via a brokerage OAuth integration, the full GEX/vanna/charm calculation layer, a streaming layer to the frontend, a columnar-storage historical replay engine, an AI narrative-brief generator, and the charting/metrics dashboard UI |
| Key decisions | Built a dedicated replay mode on columnar storage so historical sessions can be studied without a live brokerage connection; unified live, replay, and polling modes behind one toggle so the same UI works with or without market hours open; used AI to generate a plain-language narrative brief on top of the raw numeric signals |
Technical Overview
[Brokerage Options API] --OAuth--> [GEX Calculator/Orchestrator] --WebSocket--> [Dashboard UI]
                                            |                                        |
                                  [Columnar replay store] <--historical data---------+
                                            |
                                  [AI narrative brief generator]
The backend is a Node.js/Express service that authenticates against a brokerage’s options-chain API via OAuth, computes net GEX, vanna, and charm from the live chain on a polling/streaming loop, and pushes updates to the browser over a persistent WebSocket connection — separate channels for spot price, candles, GEX, and a 0DTE-specific stream. A historical replay path reconstructs the same metrics from stored tick data using a columnar query engine over Parquet files, so past sessions can be stepped through with the same UI and calculation logic as live mode. A Claude-backed service turns the numeric signal set into a short narrative brief summarizing dealer positioning and key levels. The frontend is a React SPA with a dedicated charting layer for net-GEX trend, vanna oscillator, and charm-drift visualizations, plus a metrics panel, key-levels table, and alerting UI. A single mode toggle switches the entire pipeline between live and replay sources, so the UI code never needs to know which one it’s reading from.
Challenges & Key Decisions
Making historical GEX actually replayable, not just loggable
Logging live GEX values is easy; making a past session replayable at the same fidelity as live mode is not — it means storing enough raw options-chain history to recompute every derived metric on demand, not just the final numbers. I chose a columnar store queried on demand, specifically so historical sessions could be filtered and recomputed efficiently without loading everything into memory, rather than a naive per-day data dump.
Keeping a stateful streaming service reliable through market hours
GEX calculation depends on a continuously refreshed options chain and an OAuth token that has to be silently refreshed without dropping the live connection to the browser mid-session. I built a dedicated token-persistence layer and a headless watcher service that keeps the calculation loop alive independent of whether a browser tab is open, so the streaming layer reconnects to already-warm state instead of recomputing from scratch on every dashboard load.
Turning a wall of numbers into something scannable in seconds
Net GEX, vanna, charm, and per-strike open interest are individually meaningful but slow to interpret at a glance across a multi-ticker watchlist. Rather than just tabulating raw numbers, I added an AI-generated narrative layer that summarizes the current positioning regime and flags notable levels in plain language, so the dashboard is something that can actually be scanned at a glance rather than something that requires stopping to interpret.
Lessons Learned
- Replay-first design pays off later. Building the historical replay path on the same calculation logic as live mode, rather than a simplified after-the-fact log viewer, let me debug and refine the GEX math against real historical sessions without waiting for market hours.
- A stateful streaming service needs its own lifecycle, independent of the UI. Decoupling the data-collection loop — token refresh, options polling, calculation — from whether a browser tab is open was the difference between a dashboard reliable across a full session and one that silently goes stale.
- Raw numeric signals aren’t the same as a usable dashboard. Adding an AI-generated narrative layer on top of the calculated metrics turned a data page into something that’s actually useful to glance at and act on in the moment.
Screenshot
The live GEX Profile view: net gamma exposure by strike, the volume/OI profile, key dealer hedging levels with historical hold rates, and the vanna/charm dynamics panel.